How to Analyze Feature Usage in Digital Products
Welcome back! Now that we know what features are, let's talk about something crucial - feature analysis. If you don't measure how your features are being used, you're basically flying blind. So, how do we track this effectively?
Why Track Feature Usage?
Let's say you launch a new feature. How do you know if users are actually using it? How do you know if it's helping them? That's where analytics come in! Here are three key questions to ask:
- Which features are used the most?
- Which features help convert free users into paying customers?
- Is feature usage growing over time?
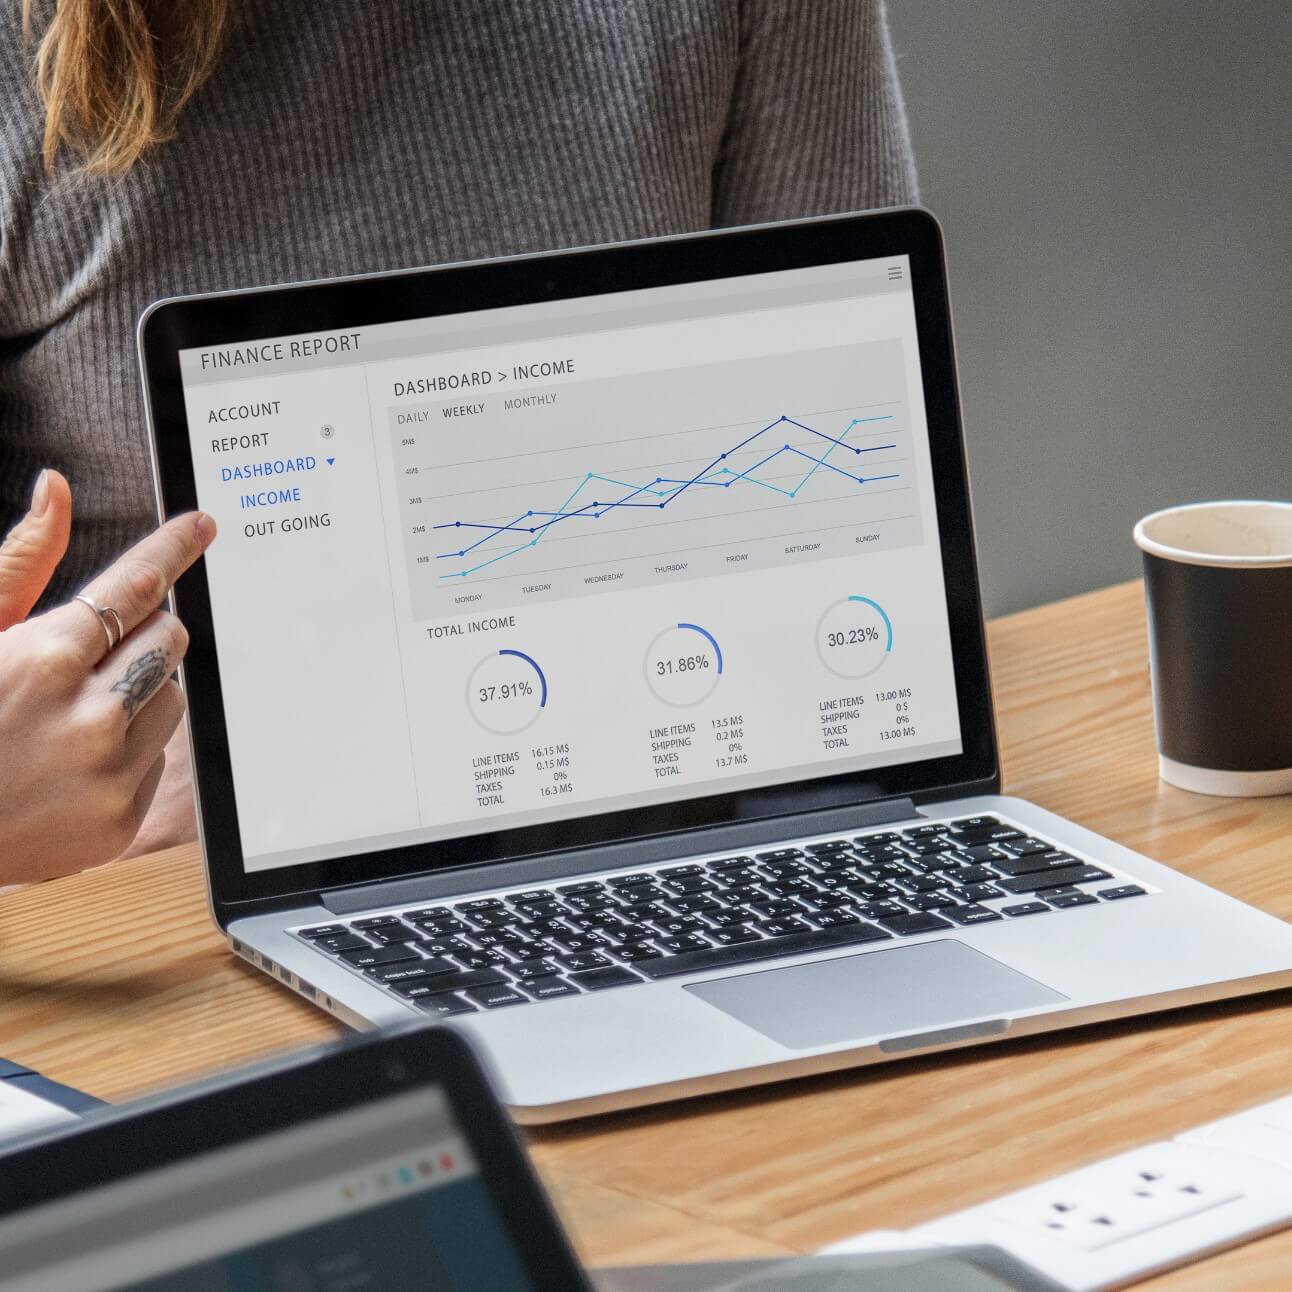
Building a Feature Analysis Dashboard
A great way to answer these questions is by setting up a feature analysis dashboard. It should include:
- 📊 A high-level overview of all core features
- 🔍 A detailed breakdown of how individual features are being used
- 📈 A retention report to see if users keep engaging with a feature over time
🚀 Pro Tip: Use event tracking and cohort analysis to understand long-term feature engagement.
Example: Blog Features
Take Blog as an example. You might want to track:
- How many users create posts
- How many users publish regularly
- How these activities impact subscriber growth
These insights help teams understand what's working and what's not.
The Takeaway
Feature analysis is your best friend if you want to improve your product. Understanding usage patterns helps teams iterate effectively.
📊 In the next post, we'll explore how to measure and iterate on feature improvements using initiative analytics. Stay tuned!